Run a workflow, describe what you want to see, and AI builds a complete dashboard from the results. A rich library of out-of-the-box widgets, a drag-and-drop dashboard builder, a dedicated widget editor, smart field mapping, and deep integration with AI chat and agentic workflows.
A full-page drag-and-drop dashboard builder with widget palette, inspector panel, and data source picker. Build dashboards manually, design custom widgets in the dedicated widget editor, or let AI generate complete layouts from workflow results. Dashboards integrate directly into AI chat, so your agentic workflows can trigger, update, and surface dashboards in real time.
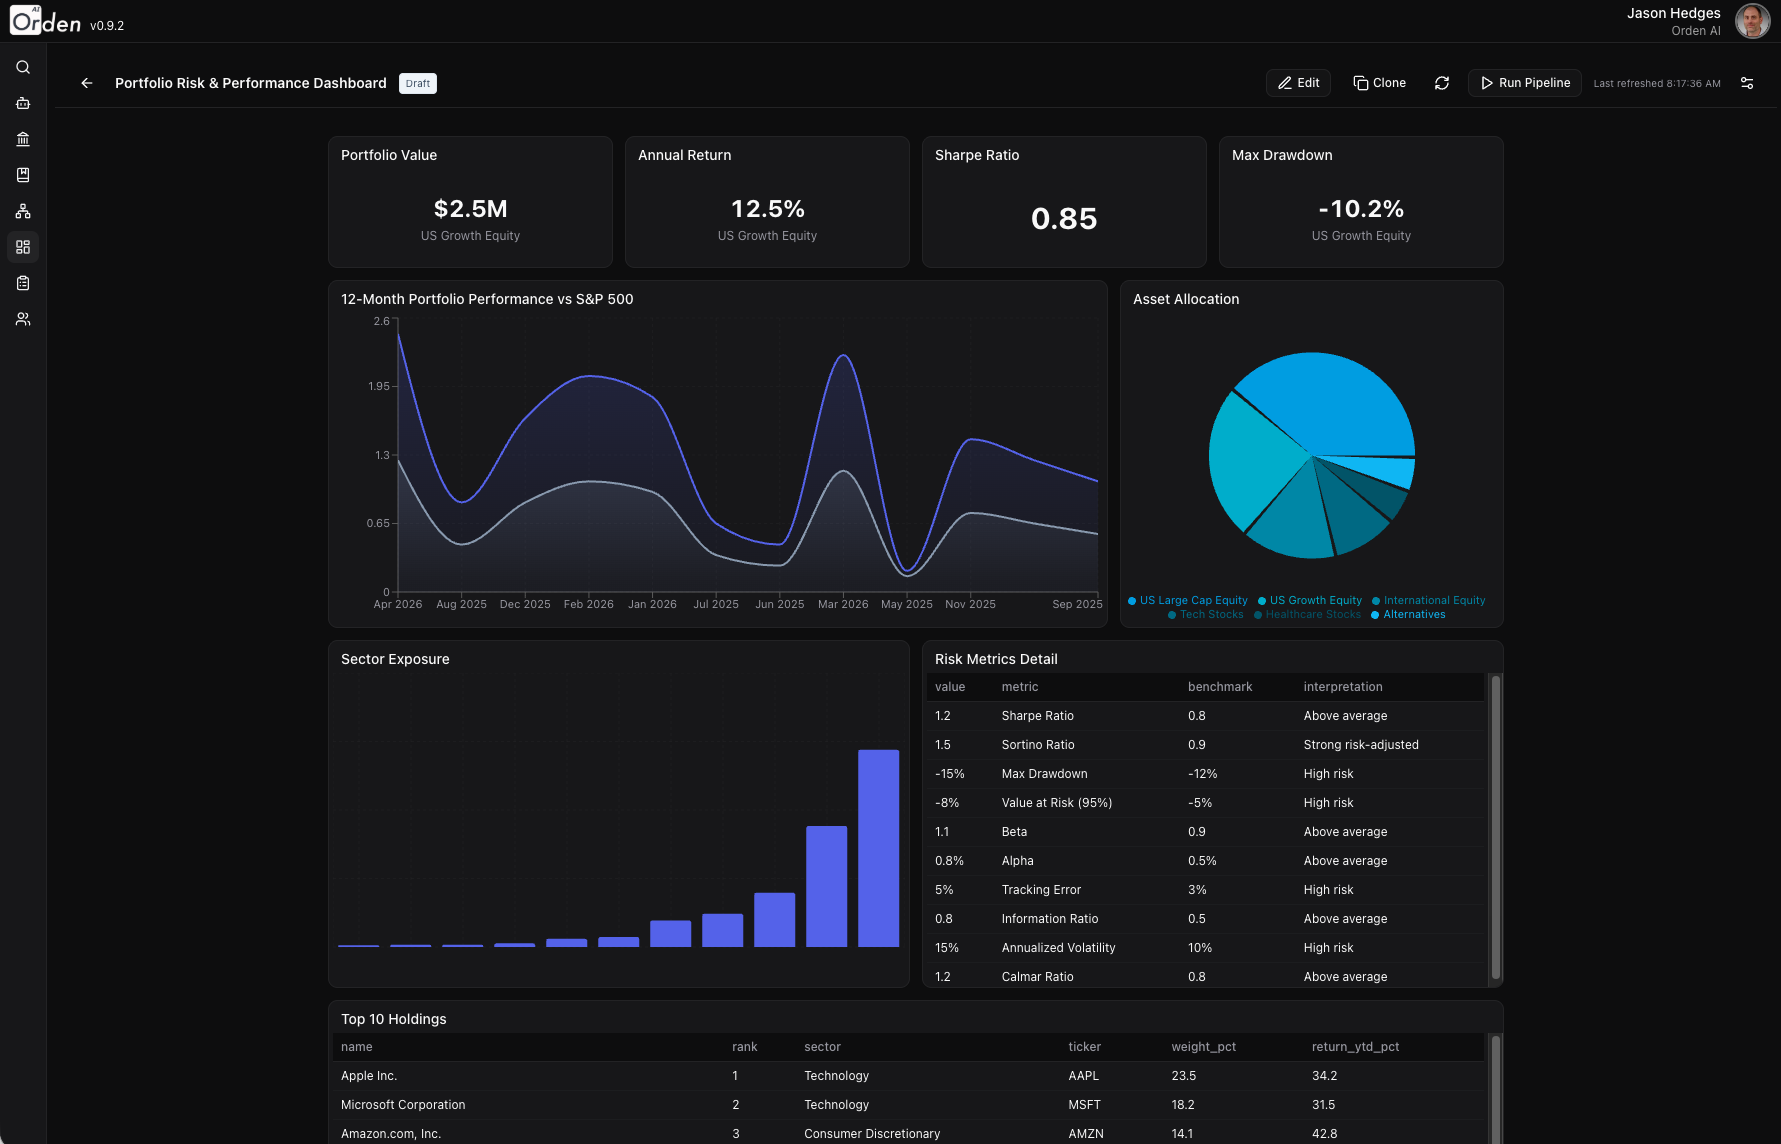
Full-page dashboard editor with widget palette and data source picker
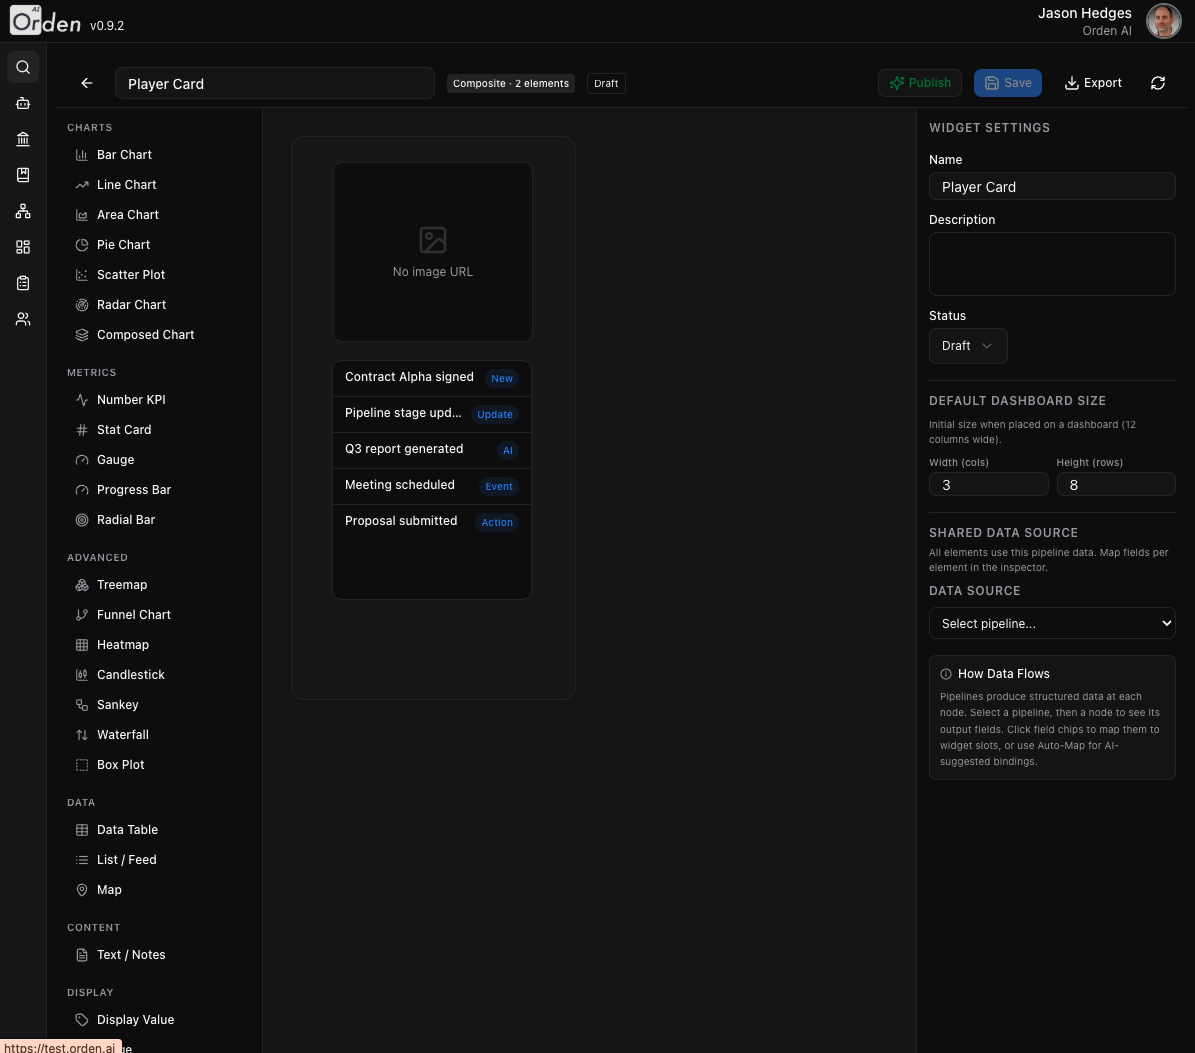
A growing library of ready-to-use widget types (from simple stat cards to interactive geo maps) plus a widget builder for creating custom visualizations tailored to your data.
After a workflow execution completes, open AI chat and describe the dashboard you need. AI introspects the output data, selects appropriate widget types, maps fields, and generates a complete layout.
Describe your visualization needs in plain English. AI selects widget types, maps data fields, and arranges the layout automatically.
AI analyzes your workflow output (field names, types, value ranges) to make intelligent decisions about how to visualize each dimension.
Dashboards appear as slide-outs in AI chat when workflows complete. Pin them to My Dashboards with one click. Agentic workflows can trigger dashboard updates, so your data visualizations stay current as they run.
AI chat creating a dashboard from workflow execution results
The Data Source Picker makes it easy to browse workflow execution outputs, discover available fields, and map them to widget axes and dimensions.
Browse workflow execution outputs with automatic type detection. See field names, data types, and sample values at a glance.
The system detects whether fields are numeric, categorical, temporal, or geographic, and suggests appropriate visualizations.
See field statistics, unique value counts, and data distributions to make informed mapping decisions.
Visual field browser with type detection and sample values
Create standalone widgets in a dedicated editor with live preview. Save to a shared library, then materialize into any dashboard or surface them directly in AI chat conversations alongside your LLM interactions.
Configure widget type, data source, and styling with instant visual feedback. See exactly how your widget will look before saving.
Share widgets with specific users or your entire organization. Control who can view, edit, or duplicate your widgets.
Pull widgets from the library into dashboards via the "From Library" tab. Widgets maintain a reference link for synchronized updates.
Export dashboards as .orden-dashboard.json files with all widget configurations and workflow dependencies bundled together.
Widget editor with live preview and configuration panel